
If you're trying to control your team's AI costs by setting hard limits, you're doing it wrong.
Limits don't teach people how to use AI well. They just teach them to stop using it when the cap hits — so they don't have to ask for more. That's the opposite of what you want.
Here's what's working for my team instead:
A Shared AI Cost Dashboard
Everyone on the team can see everyone else's usage — daily, weekly, monthly. Spend by user. Spend by model. Spend by day. It's not a surveillance tool. It's an education tool.
When a developer can see that a teammate shipped the same kind of work for a fraction of the cost, they ask why. And that conversation is where the real learning happens.
The model we try to follow:
• Opus → planning
• Sonnet → executing the plan
• Haiku → quick questions
Most people open Claude or Copilot, default to the most powerful model, and never realize they're paying 5–10x more for the same output they'd get from Sonnet.
Neither Anthropic nor Microsoft makes this data easy to extract. But with some determination (and, fittingly, some AI), I pulled together exactly what we needed.
If you're struggling to manage AI spend on your team: don't start with limits. Start with visibility. Have AI help you build the dashboard. Then let your engineers teach each other.
Control follows education — not the other way around.
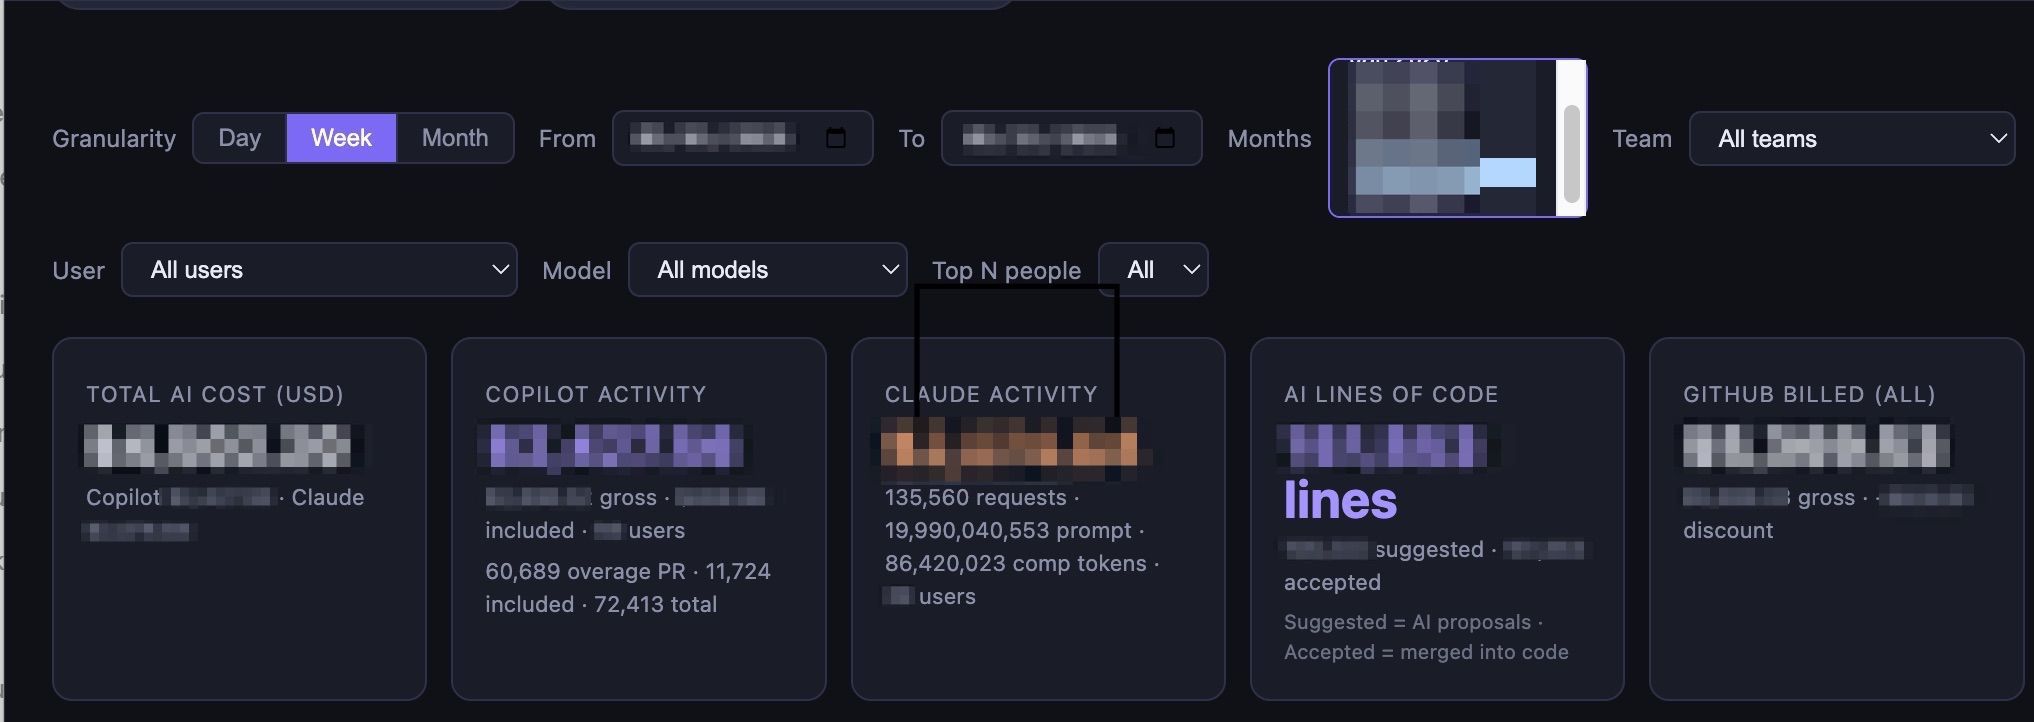
1. Monthly spend at a glance
The view I check first thing — total team spend across all tools, trending against the month.
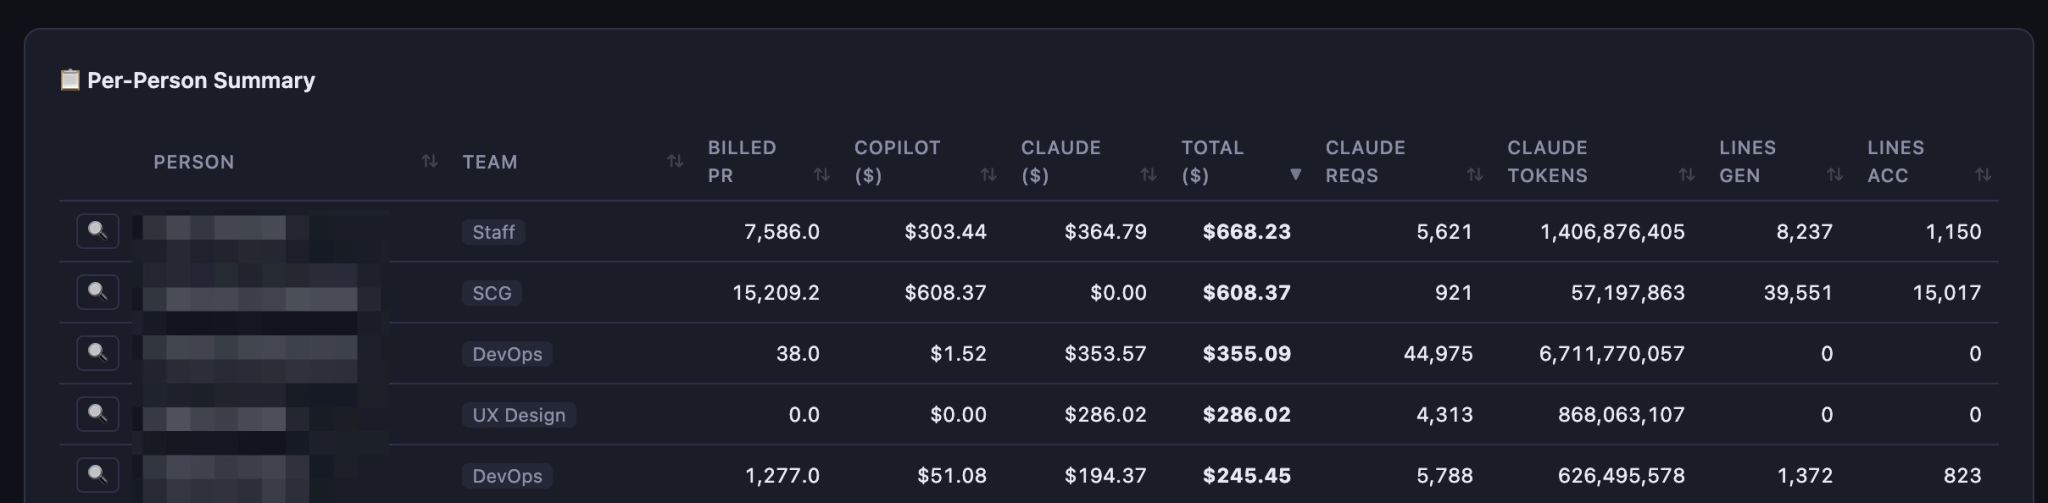
2. Spend per developer, over time
Daily, weekly, or monthly. Everyone on the team can see this — including their own line.
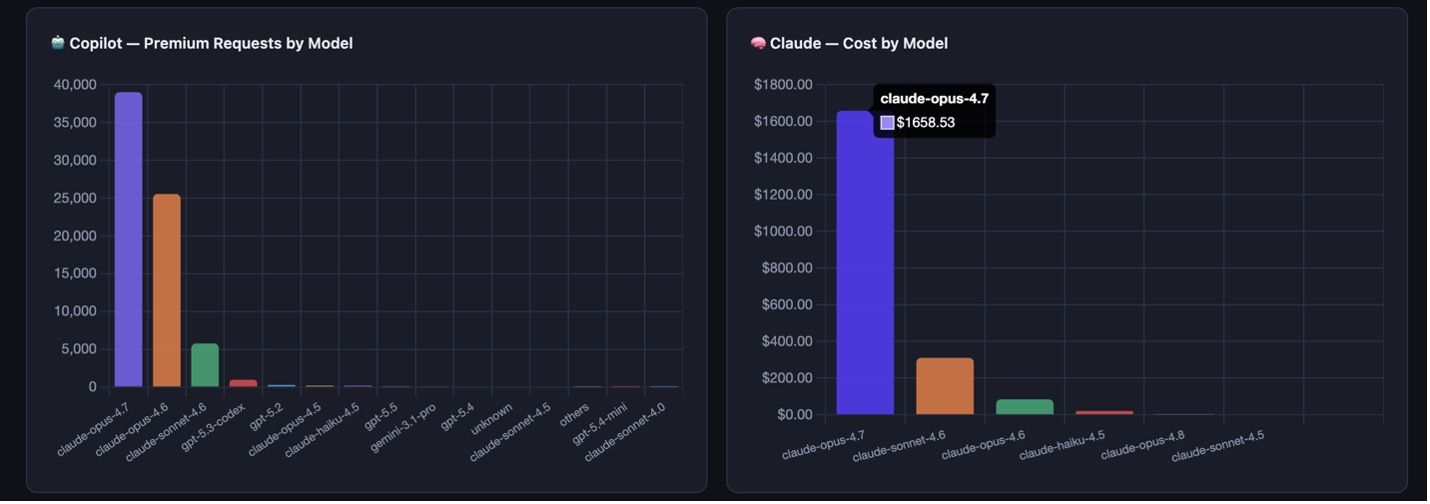
3. Spend by model
Where the Opus vs. Sonnet vs. Haiku conversation starts. Usually, the surprise is how much Opus is doing for tasks Sonnet would handle.
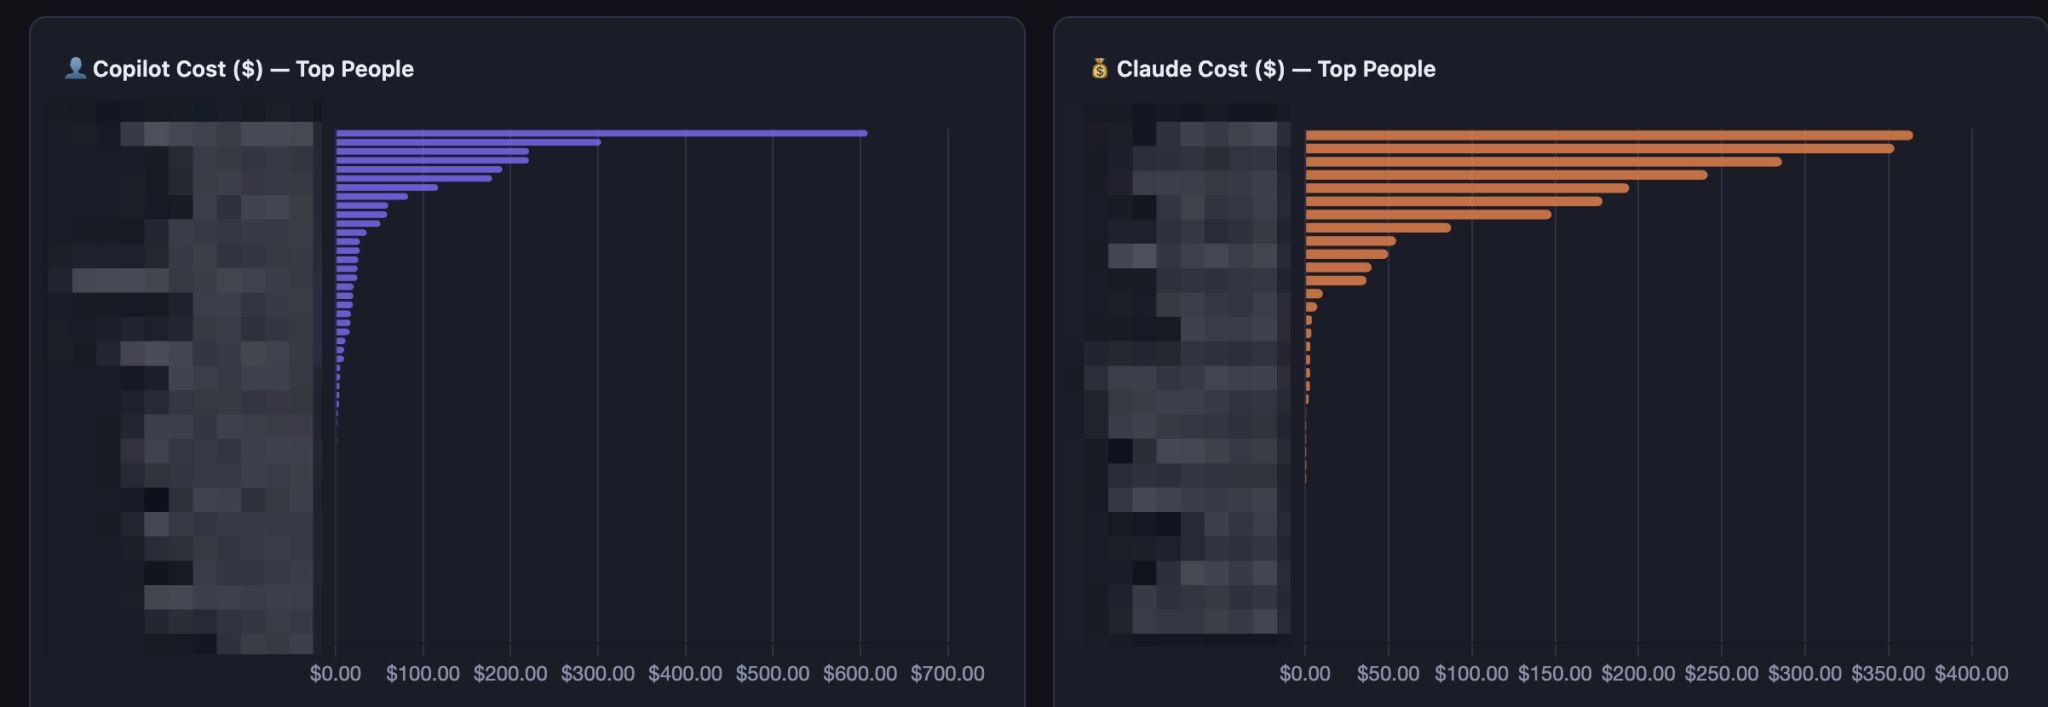
4. Spend by developer
Same data, different cut. This is the chart that drives the peer conversations — why is one engineer getting more done for less?
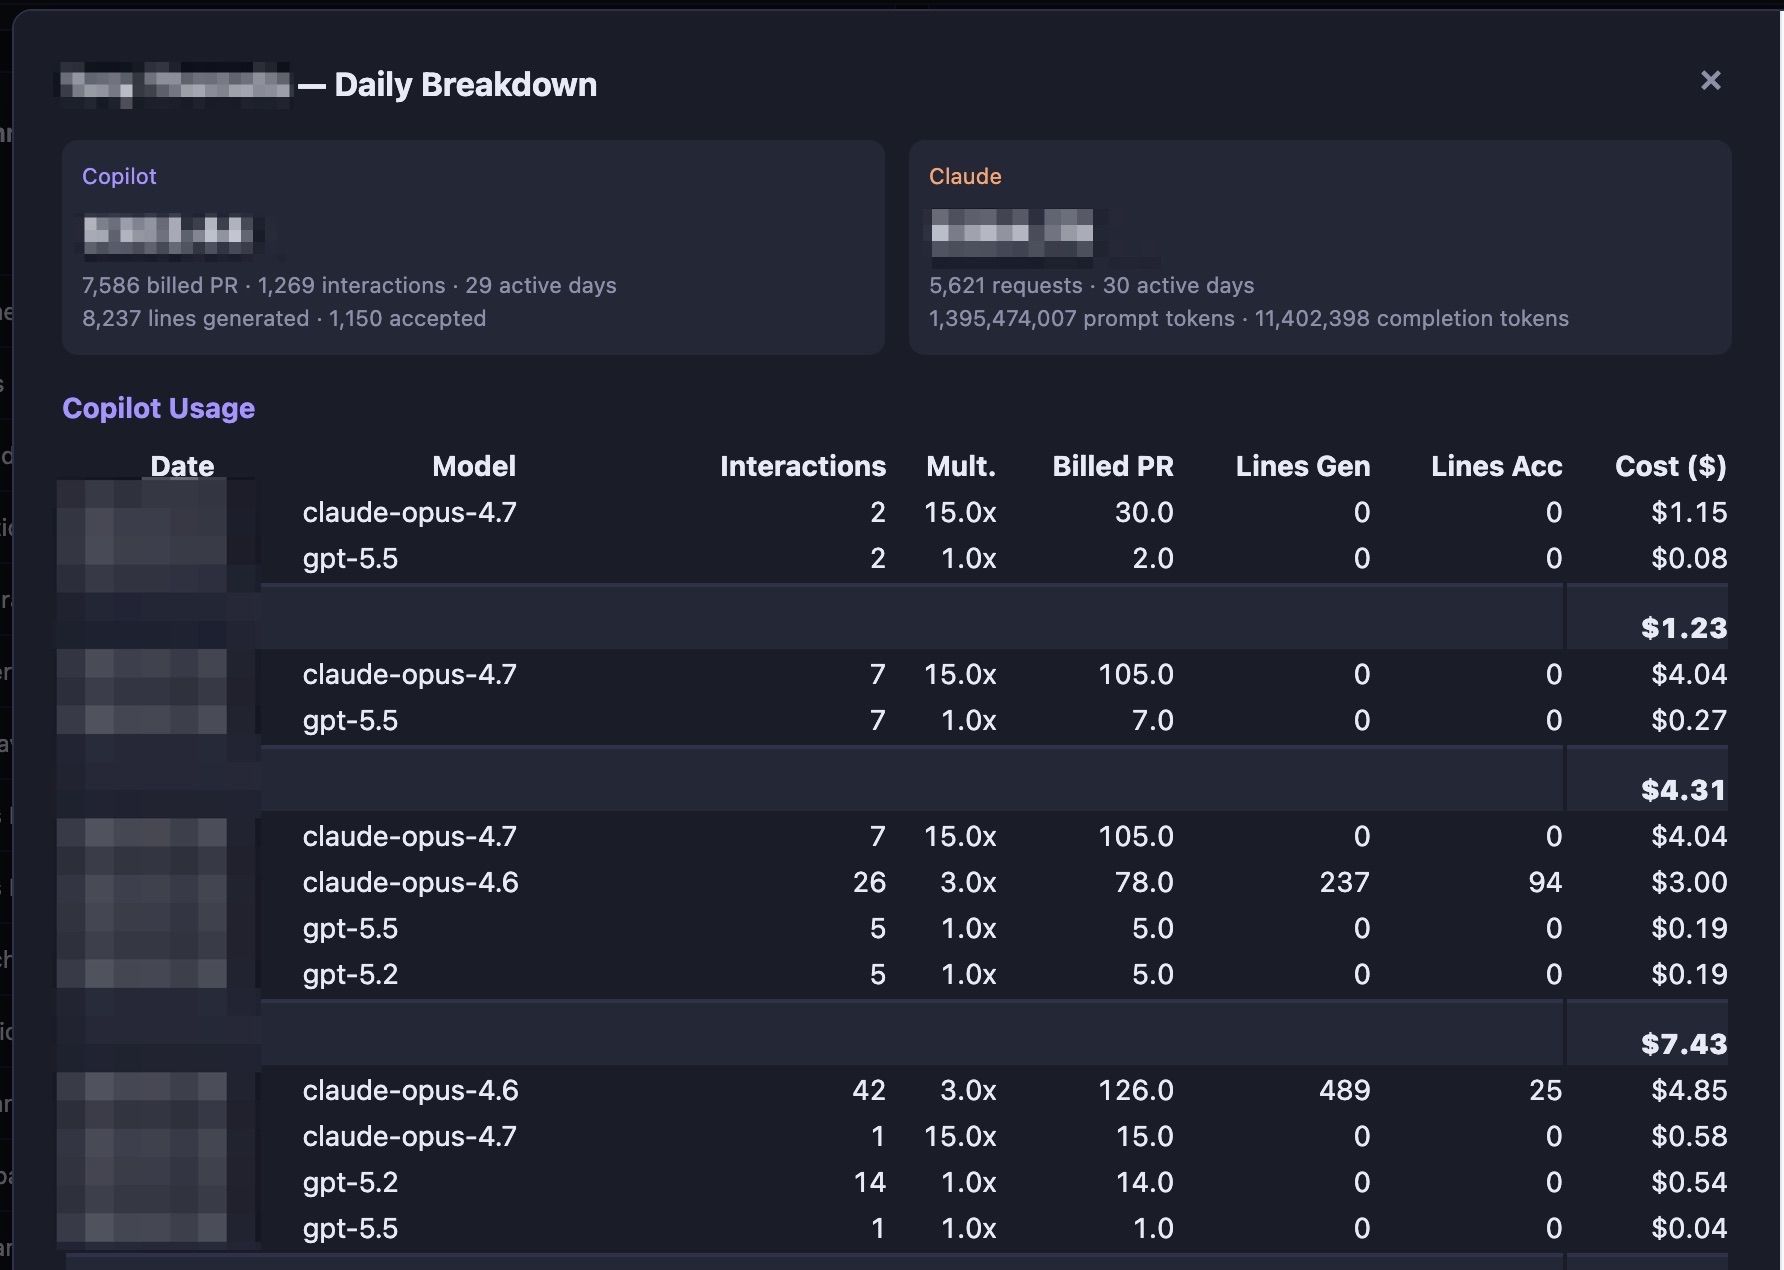
5. Daily breakdown
Drill into a single day so a developer can tie spend back to what they shipped.
The goal was never to spend less on AI. The goal is to get more out of it.
When your team can see what they're spending and why, they figure out the right model for the right task. Not because you told them to, but because the data made it obvious.
Build the dashboard. Get out of the way. Let the team optimize itself.
